SMM Market Intelligence
Understand the SMM market before your competitors
Compare panels, prices, services and provider relationships from current public data. Decide on evidence, not guesses.
- Free accountSign up in a minute
- Fresh dataCatalogs re-read every few hours
- Open methodEvery formula published
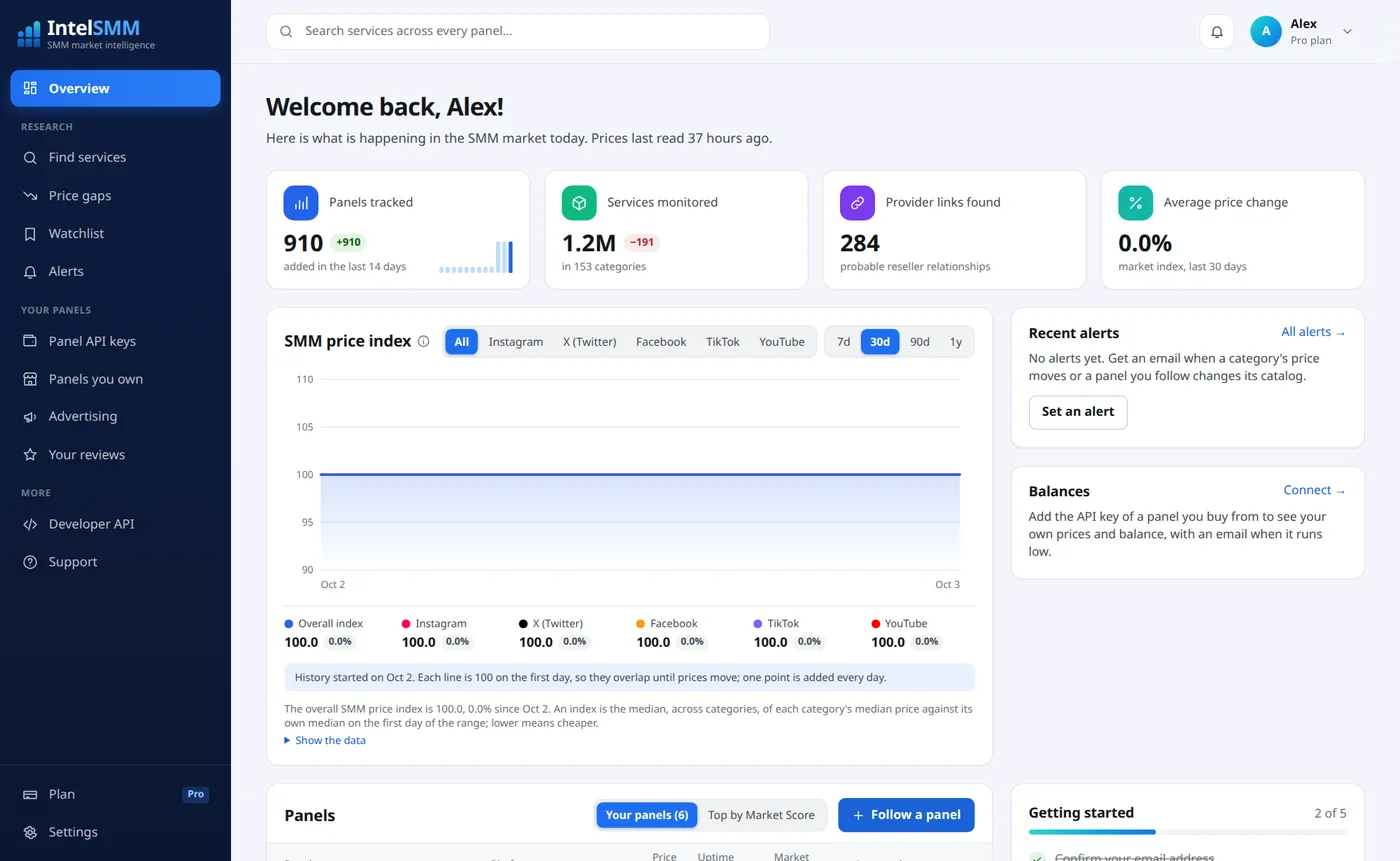
Everything you need to read the SMM market
One place for prices, history, providers and signals.
Panel comparison
Put panels side by side: prices in shared categories, uptime, catalog size and Market Score.
Price history
Every price change is recorded, so you can see how a service and the whole market moved.
Provider detection
Find which panels resell which, from matching catalogs and steady markups, with a stated confidence.
Market signals
The largest price moves, new services and catalog changes, every day.
The market today
Price indexes and the largest moves of the week, from today's statistics.
SMM price index
- Overall index103.3+3.3%
- Instagram110.4+10.4%
- X (Twitter)105.9+5.9%
- Facebook108.6+8.6%
- TikTok104.0+4.0%
- YouTube99.9−0.1%
Show the data
| Date | SMM market | X (Twitter) | TikTok | YouTube | ||
|---|---|---|---|---|---|---|
| 2026-10-03 | 100.0 | 100.0 | 100.0 | 100.0 | 100.0 | 100.0 |
| 2026-10-04 | 99.6 | 97.5 | 99.9 | 97.8 | 99.9 | 99.8 |
| 2026-10-05 | 99.4 | 97.5 | 99.7 | 97.5 | 99.8 | 99.7 |
| 2026-10-06 | 99.4 | 96.9 | 99.9 | 97.2 | 99.6 | 99.7 |
| 2026-10-07 | 99.3 | 97.5 | 98.7 | 97.1 | 99.6 | 98.9 |
| 2026-10-08 | 98.9 | 97.4 | 98.6 | 97.1 | 98.2 | 98.7 |
| 2026-10-09 | 98.7 | 97.5 | 98.4 | 97.4 | 98.1 | 98.9 |
| 2026-10-10 | 99.1 | 98.4 | 99.2 | 98.4 | 98.3 | 98.9 |
| 2026-10-11 | 99.0 | 98.5 | 98.9 | 98.5 | 98.3 | 98.9 |
| 2026-10-12 | 102.4 | 110.2 | 104.3 | 111.8 | 101.5 | 99.4 |
| 2026-10-13 | 102.1 | 110.4 | 103.6 | 110.2 | 101.6 | 99.6 |
| 2026-10-14 | 102.8 | 111.0 | 104.2 | 111.0 | 101.5 | 99.5 |
| 2026-10-15 | 102.4 | 109.6 | 103.8 | 110.1 | 101.3 | 99.5 |
| 2026-10-16 | 102.9 | 110.8 | 103.7 | 109.0 | 102.1 | 99.4 |
| 2026-10-17 | 103.1 | 110.8 | 104.1 | 108.9 | 102.2 | 99.5 |
| 2026-10-18 | 103.1 | 112.2 | 104.0 | 108.8 | 102.4 | 99.6 |
| 2026-10-19 | 103.3 | 110.9 | 104.1 | 108.3 | 102.2 | 100.7 |
| 2026-10-20 | 103.1 | 110.5 | 104.0 | 110.1 | 102.1 | 100.1 |
| 2026-10-21 | 102.9 | 110.6 | 104.2 | 110.1 | 102.4 | 100.0 |
| 2026-10-22 | 103.2 | 110.7 | 105.4 | 109.8 | 102.5 | 99.9 |
| 2026-10-23 | 103.2 | 110.9 | 105.9 | 109.5 | 102.2 | 99.9 |
| 2026-10-24 | 103.6 | 110.6 | 106.2 | 109.1 | 102.2 | 99.9 |
| 2026-10-25 | 103.5 | 110.8 | 107.0 | 107.9 | 102.5 | 99.8 |
| 2026-10-26 | 103.5 | 110.7 | 106.5 | 107.9 | 105.5 | 99.9 |
| 2026-10-27 | 102.9 | 110.9 | 107.3 | 109.9 | 103.7 | 99.8 |
| 2026-10-28 | 103.2 | 111.1 | 105.8 | 108.7 | 103.5 | 99.9 |
| 2026-10-29 | 103.2 | 110.9 | 105.9 | 108.5 | 103.6 | 100.5 |
| 2026-10-30 | 103.2 | 110.3 | 105.8 | 108.9 | 103.6 | 100.1 |
| 2026-10-31 | 103.0 | 110.4 | 105.9 | 108.6 | 103.7 | 100.0 |
| 2026-11-01 | 103.3 | 110.4 | 105.9 | 108.6 | 104.0 | 99.9 |
| 2026-11-02 | 103.3 | 110.4 | 105.9 | 108.6 | 104.0 | 99.9 |
Cheapest today
The lowest current price in the most popular categories.
- Lowest
- $0.0111
- Median
- $0.82
- 30-day change
- +25.4%
95,162 services from 1,088 panels
- Lowest
- $0.001
- Median
- $0.16
- 30-day change
- −6.9%
43,530 services from 992 panels
- Lowest
- $0.069
- Median
- $3.44
- 30-day change
- −1.5%
99,493 services from 987 panels
- Lowest
- $0.0285
- Median
- $3.09
- 30-day change
- +35.5%
78,576 services from 903 panels
- Lowest
- $0.0801
- Median
- $4.61
- 30-day change
- +2.4%
99,645 services from 1,077 panels
Browse by platform
Prices for every service type, per platform.
- Instagram326.7K services
- TikTok189.7K services
- YouTube221.4K services
- Telegram230.9K services
- Facebook194K services
- X (Twitter)77.6K services
- Spotify83.7K services
- Twitch20.9K services
- Discord2,937 services
- Reddit3,726 services
- LinkedIn10.1K services
- Pinterest2,085 services
- Snapchat7,386 services
- Threads6,299 services
- WhatsApp15.7K services
- Kick13.1K services
- VK4,744 services
- SoundCloud5,763 services
- Bluesky1,532 services
- Roblox453 services
- Rumble2,896 services
- Likee2,095 services
- Kwai5,526 services
- Quora2,329 services
- Medium279 services
- Truth Social462 services
- MAX513 services
- Dzen (Yandex Zen)942 services
- Tidal603 services
- Shopee8,354 services
- CHZZK154 services
- LINE956 services
- Audiomack4,774 services
- Boomplay1,484 services
- Deezer1,327 services
- Apple Music428 services
- Podcasts1,408 services
- Shazam344 services
- Mixcloud305 services
- ReverbNation253 services
- Tumblr1,597 services
- Vimeo1,022 services
- Rutube1,097 services
- Dailymotion95 services
- Trovo549 services
- Bigo Live286 services
- Clubhouse2,140 services
- OK.ru627 services
- Xiaohongshu (RedNote)201 services
- OnlyFans123 services
- Behance290 services
- Dribbble373 services
- GitHub262 services
- Google Maps Reviews1,125 services
- Trustpilot1,412 services
- Tripadvisor613 services
- IMDb190 services
- App Stores381 services
- CoinMarketCap1,123 services
- CoinGecko81 services
- OpenSea242 services
- Website Traffic130.8K services
How it works
From public catalogs to market figures in three steps.
- Step 1
Collect
An identified crawler reads public service pages and owner-authorised APIs at polite intervals.
About the crawler → - Step 2
Normalize and compare
Every service is classified by platform and type and its price converted to USD per 1,000.
Data sources → - Step 3
Show the market
Daily statistics, price indexes, scores and changes, with every formula published.
Methodology →
Who IntelSMM is for
The same data, read for different decisions.
For panel owners
- Claim your panel for free and get the Owner verified badge
- See where your prices sit against every category
- Track page views and visits to your site
For resellers and buyers
- Compare prices for the same service across panels
- Find who sells it cheaper, with your own API prices
- Get an email when a balance runs low
For market analysts
- Daily price indexes by platform and category
- Provider relationships and reseller markups
- CSV exports and a JSON API
Reports and research
Computed from the stored history and published with the method.
Top panels by Market Score
Organic ranking from measured data; payment cannot change it. How the score works.
| Panel | Market Score | Services | Platforms | Price index |
|---|---|---|---|---|
socialmediagrowtips.com socialmediagrowtips.com | 91 | 5,578 | 37 | — |
medyabayim.com medyabayim.com | 89 | 6,253 | 37 | — |
| 89 | 2,521 | 25 | 0.63× | |
smmgreat.com smmgreat.com | 88 | 2,035 | 18 | 0.39× |
fastersmm.com fastersmm.com | 88 | 4,988 | 24 | 0.54× |
vinasmm.com vinasmm.com | 88 | 1,981 | 22 | 0.45× |
medyabay.com medyabay.com | 88 | 5,319 | 9 | 0.20× |
smmearth.com smmearth.com | 88 | 327 | 18 | — |
| 87 | 3,731 | 35 | 0.69× | |
thinkapples.com thinkapples.com | 87 | 3,620 | 27 | — |
Plans
Market prices are free to browse. A free account shows more, and Pro shows every service, panel and price.
Free
$0/ month
- Market prices, panel pages and comparisons
- The first 25 services of every category, with panel names
- 30-day price and uptime history on panel pages
- Find services: 5 searches a day
- Free tools, claiming your panel and the public API
Pro
$29/ month
- Every service of every category, every page and filter
- Find services without a limit
- Full price, score and uptime history
- Provider identities, reseller lists and catalog matches
- Price gaps with the cheaper panels' names and service IDs
- CSV exports of categories, panel catalogs and reseller lists
- Watchlist (up to 200) and email alerts (up to 25)
- Low-balance emails and higher API limits
Business
$99/ month
- Everything in Pro
- Historical market data export
- Paid API: providers, relationships and history
- Up to 200 alerts and 2000 saved items
- Highest API limits
Frequently asked questions
- Does IntelSMM sell followers, likes or views?
- No. IntelSMM does not sell social media services and does not accept orders. It collects publicly available SMM panel catalogs and publishes prices, history and statistics about them.
- Where do the prices come from?
- From public panel service pages and from APIs whose access the panel owner authorised. Every price is converted to US dollars per 1,000 units so panels can be compared.
- Can a panel pay to rank higher?
- No. The Market Score and the order of every price table are computed from measured data only. Advertising, where it appears, is labelled as sponsored and kept separate from organic results.
- What does "HQ", "real" or "non-drop" mean in a service row?
- Those are labels the panel puts in its own service names. IntelSMM shows them as the panel's claims and does not verify them.
- What is the Market Score?
- A 0 to 100 score built from uptime, price competitiveness, catalog depth, catalog stability, transparency and domain history. The formula and its weights are on the methodology page.
Get market signals and find better offers sooner
Create a free account for the cabinet: service search, price gaps, alerts and your own panel prices.